Homelessness 101: What do all the numbers mean?
Communications Admin • July 18, 2018
Data plays an integral part of the day-to-day operations at the Coalition for the Homeless and drives our decision making activities as lead agency to The Way Home. The Coalition also manages the Homeless Management Information System(HMIS). HMIS is a database that captures client information over time on the characteristics of and services used by individuals and families experiencing homelessness.
Data is entered into HMIS by direct service providers and is used by those same agencies to generate reports about services and number of clients served; the Coalition uses HMIS to produce system wide reports and analysis about our performance as a community.
Because of all of this data collection, there are a lot of different counts and numbers that the Coalition uses and releases – but what do they all mean?
In particular, there are two different counts shown on our website. One of those numbers is the annual Homeless Count & Survey total, which is a “snapshot” of the homeless population in the Houston region on a given night. The other number is an annual number that shows how many people use homeless or homeless-related services over the course of a year. These two counts are very different and are used to tell us unique information.
Homeless Count & Survey
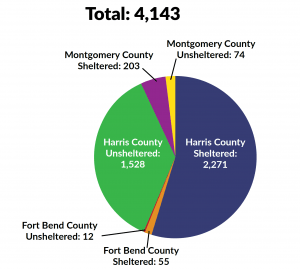
The annual Homeless Count & Survey is coordinated by the Coalition every January and tells us how many people are experiencing literal homelessness on a single night, whether that is in an emergency shelter or somewhere not meant for human habitation. Hundreds of staff members from partner agencies of The Way Home canvass across Harris, Fort Bend, and Montgomery Counties, looking for individuals experiencing unsheltered homelessness; while emergency shelters submit their information on sheltered individuals through HMIS.
In 2018, the total number of people experiencing literal homelessness on a single night was 4,143 across our three-county geography. We know that this number is not perfect – we might be missing some people in our count, or we could be over-counting. However, we collect our Homeless Count data in the same way, at the same time each year, and allows us to compare the data from year-to-year and look at trends over time. Homeless Count data can answer questions like, “Is our overall homeless population decreasing?” or “Are we still at steady state regarding Veteran homelessness?”
The Annual Count
The larger number on our website is an annual count and shows how many unique individuals access a homeless or related service over the course of a year. In 2017, 37,246 people accessed some type of homeless or homeless-related service according to our HMIS. These services could have been anything from permanent housing and case management to food pantry services or job training.
This does not necessarily mean that all 37,000 people experienced literal homelessness in 2017, though some of them were and were entered in HMIS as receiving street outreach services or emergency shelter stays. Some of those individuals may have received homeless prevention services such as emergency rental assistance. Also, people who are enrolled in Permanent Supportive Housing through The Way Home may receive regular services like case management or healthcare visits for the rest of their lives.
This annual number is really important since it shows us not just literal homelessness, but also how many people might find themselves facing housing or economic uncertainty in a given year. Also, the total number of individuals accessing homeless services increased from 2016 to 2017, and this trend will most likely continue as more programs and services continue to become available in our community.
The Coalition believes in using data to drive our decisions when it comes to solving homelessness in the Houston region. We hope this educational blog post has helped clarify the differences between two of our most well-known counts! Visit the Local Data and Research section of our website for more information.

Extreme Heat Is America's Deadliest Weather Hazard. Find Trusted Resources to Stay Safe and Help Others.
Houston, Texas (June 12, 2026) — The Coalition for the Homeless of Houston/Harris County (CFTH) today released the results of the 2026 Point-in-Time Count & Survey as part of the inaugural State of Homelessness in Houston report, a regional effort that combines PIT Count data with additional system indicators to provide a broader understanding of homelessness and system response across Harris, Fort Bend, and Montgomery counties. The report found 3,321 people experiencing homelessness on a single night in February 2026, reflecting relative stability compared to the 2025 Point-in-Time Count of 3,325. At the same time, the data highlights continued challenges related to unsheltered homelessness, economic and housing pressures, and the ongoing need for coordinated regional investment in homeless response and prevention efforts. This year’s report expands beyond the annual Point-in-Time (PIT) Count to include additional indicators generated through the Homeless Management Information System (HMIS) and HUD System Performance Measures (SPMs). Together, these measures provide additional context about year-round interactions with the homeless response system, housing stability outcomes, and inflow into homelessness over time. "The Point-in-Time Count is like a photograph," said Renee Cavazos-Benavides, vice president of the homeless response system at CFTH . "It captures an important moment, but there is always more happening outside the frame. That's why this year's report includes additional indicators that help us understand how people move into homelessness, how they move back into housing, and where we need to focus our efforts as a community." Key findings from the report include: 3,321 people experiencing homelessness during the February 2026 PIT Count 35,988 unique clients served through the homeless response system, The Way Home, during calendar year 2025 2,135 households housed by partners of The Way Home during calendar year 2025 7,110 people entering homelessness for the first time during federal FY25 85% of people who exited homelessness remained stably housed over a two-year period The PIT Count found 2,051 sheltered individuals and 1,270 unsheltered individuals across Harris, Fort Bend, and Montgomery counties. "The additional data shows our system is doing a great job maintaining our progress, in spite of additional economic stressors and pandemic funding having been exhausted,” said Kelly Young, president and CEO of CFTH . “Further progress will depend not only on additional investments in housing and services but also on our ability to expand new interventions to resolve homelessness more quickly." More than half of unsheltered individuals identified during the PIT Count had a matching HMIS record, reflecting ongoing engagement between outreach teams and people experiencing unsheltered homelessness. The findings underscore the continued need for outreach, additional pathways indoors, and sustained local investment to maintain system stability and respond to changing community needs. “The Point-in-Time Count gives our community a chance to pause and check in with people who may not yet be housed, sheltered, or consistently connected to services,” said Dr. Ben King, clinical assistant professor at the University of Houston Tilman J. Fertitta Family College of Medicine . “It helps us capture information that does not always show up in routine system data — including where people are staying, what barriers they are facing, and what they identify as the causes of their homelessness. Used alongside HMIS data, program performance measures, and community input, the PIT Count remains an important tool to answer questions we wouldn't get to ask otherwise." The annual PIT Count is required by the U.S. Department of Housing and Urban Development (HUD) and helps communities measure trends in homelessness over time. However, the PIT Count does not represent the total number of people who experience homelessness throughout the year. The 2026 State of Homelessness in Houston report combines PIT Count data with other key indicators to provide a more complete picture of homelessness across the region. Behind every number is a person, and a better understanding of homelessness helps communities respond more effectively. "The results remind us that homelessness is one of the most complex challenges facing our city. This is why the 419 Emancipation resource living facility is so important. We will continue working with stakeholders to move people off the streets and provide them with assistance, with the goal of reducing homelessness throughout our community and our neighborhoods," said Mayor John Whitmire. “I’m so proud that Harris County has reduced homelessness by more than 16% between 2018 and 2026, even when most other communities have seen homelessness skyrocket. We’re tackling the issue from both ends: we’re investing in programs to prevent poverty and promote economic mobility, and we’re also prioritizing safe and stable housing for those experiencing homelessness. Our community is only as successful as our most vulnerable residents, and I want to thank the Coalition for the Homeless, The Way Home, and all of our other local partners who have helped turn Harris County into a national model for reducing homelessness,” said Harris County Judge Lina Hidalgo. "The 2026 Point-in-Time Count confirms that our region has remained stable while homelessness has increased in many other parts of the country. However, stability is not enough when over a thousand of our neighbors are still sleeping outside. I’m grateful to the Coalition for the Homeless, The Way Home, outreach teams, law enforcement, service providers, and volunteers for showing that a coordinated local approach can help move people from crisis toward housing,” said Harris County Precinct 2 Commissioner Adrian Garcia . “As a former street cop and sheriff, I know we do not solve homelessness by simply moving people from one place to another. We solve it by treating people with dignity, connecting them to services, and creating real pathways to housing. I remain committed to working with our partners to prevent homelessness, support our veterans and most vulnerable residents, and make homelessness rare, brief, and nonrecurring in Harris County." “Harris County’s stability in the Point‑in‑Time Count stands out against the sharp increase in homelessness seen nationwide since the pandemic,” said Harris County Precinct 4 Commissioner Lesley Briones . “These results reflect years of continued investment in strengthening partnerships and expanding critical services, including two new emergency shelters for survivors of domestic violence. We know there is much more work ahead, and I remain committed to working alongside our partners to prevent and ultimately end homelessness in our community.” “Even with limited new funding and few new programs launched during this reporting period, Houston has remained relatively stable. What this latest data underscores is the need to continue investing in service-connected solutions like 419 Emancipation,” said Mike Nichols, Director of the City of Houston Housing and Community Development Department . “Now that 419 is operational, we are optimistic this triage, transition, and treatment model will help connect more individuals to care, services, and clear pathways toward stability. Behind every number is a real person, and our goal is to ensure more Houstonians are connected to the right support and a stronger path forward.” The full report and methodology appendix are available online here. The executive summary is available online here. The State of Homelessness report is available online here. For more information about the PIT Count and The Way Home homeless response system, visit www.cfthhouston.org. For more information and for results of previous years’ counts, please click here . For photos and B roll of volunteers conducting this year’s PIT Count, click here. ### The Coalition for the Homeless of Houston/Harris County (CFTH) is the backbone of Houston’s solutions to homelessness. It’s a nonprofit organization that uses the power of collective impact to move people experiencing homelessness into housing solutions. Learn more at www.cfthhouston.org . The Way Home is the homeless response system for Houston and Harris, Fort Bend, and Montgomery counties. It’s a public-private partnership — a network of dozens of homeless service providers and other government, philanthropic, and business partners. The Coalition for the Homeless of Houston/Harris County (CFTH), a 501c3, is the designated coordinator of The Way Home.
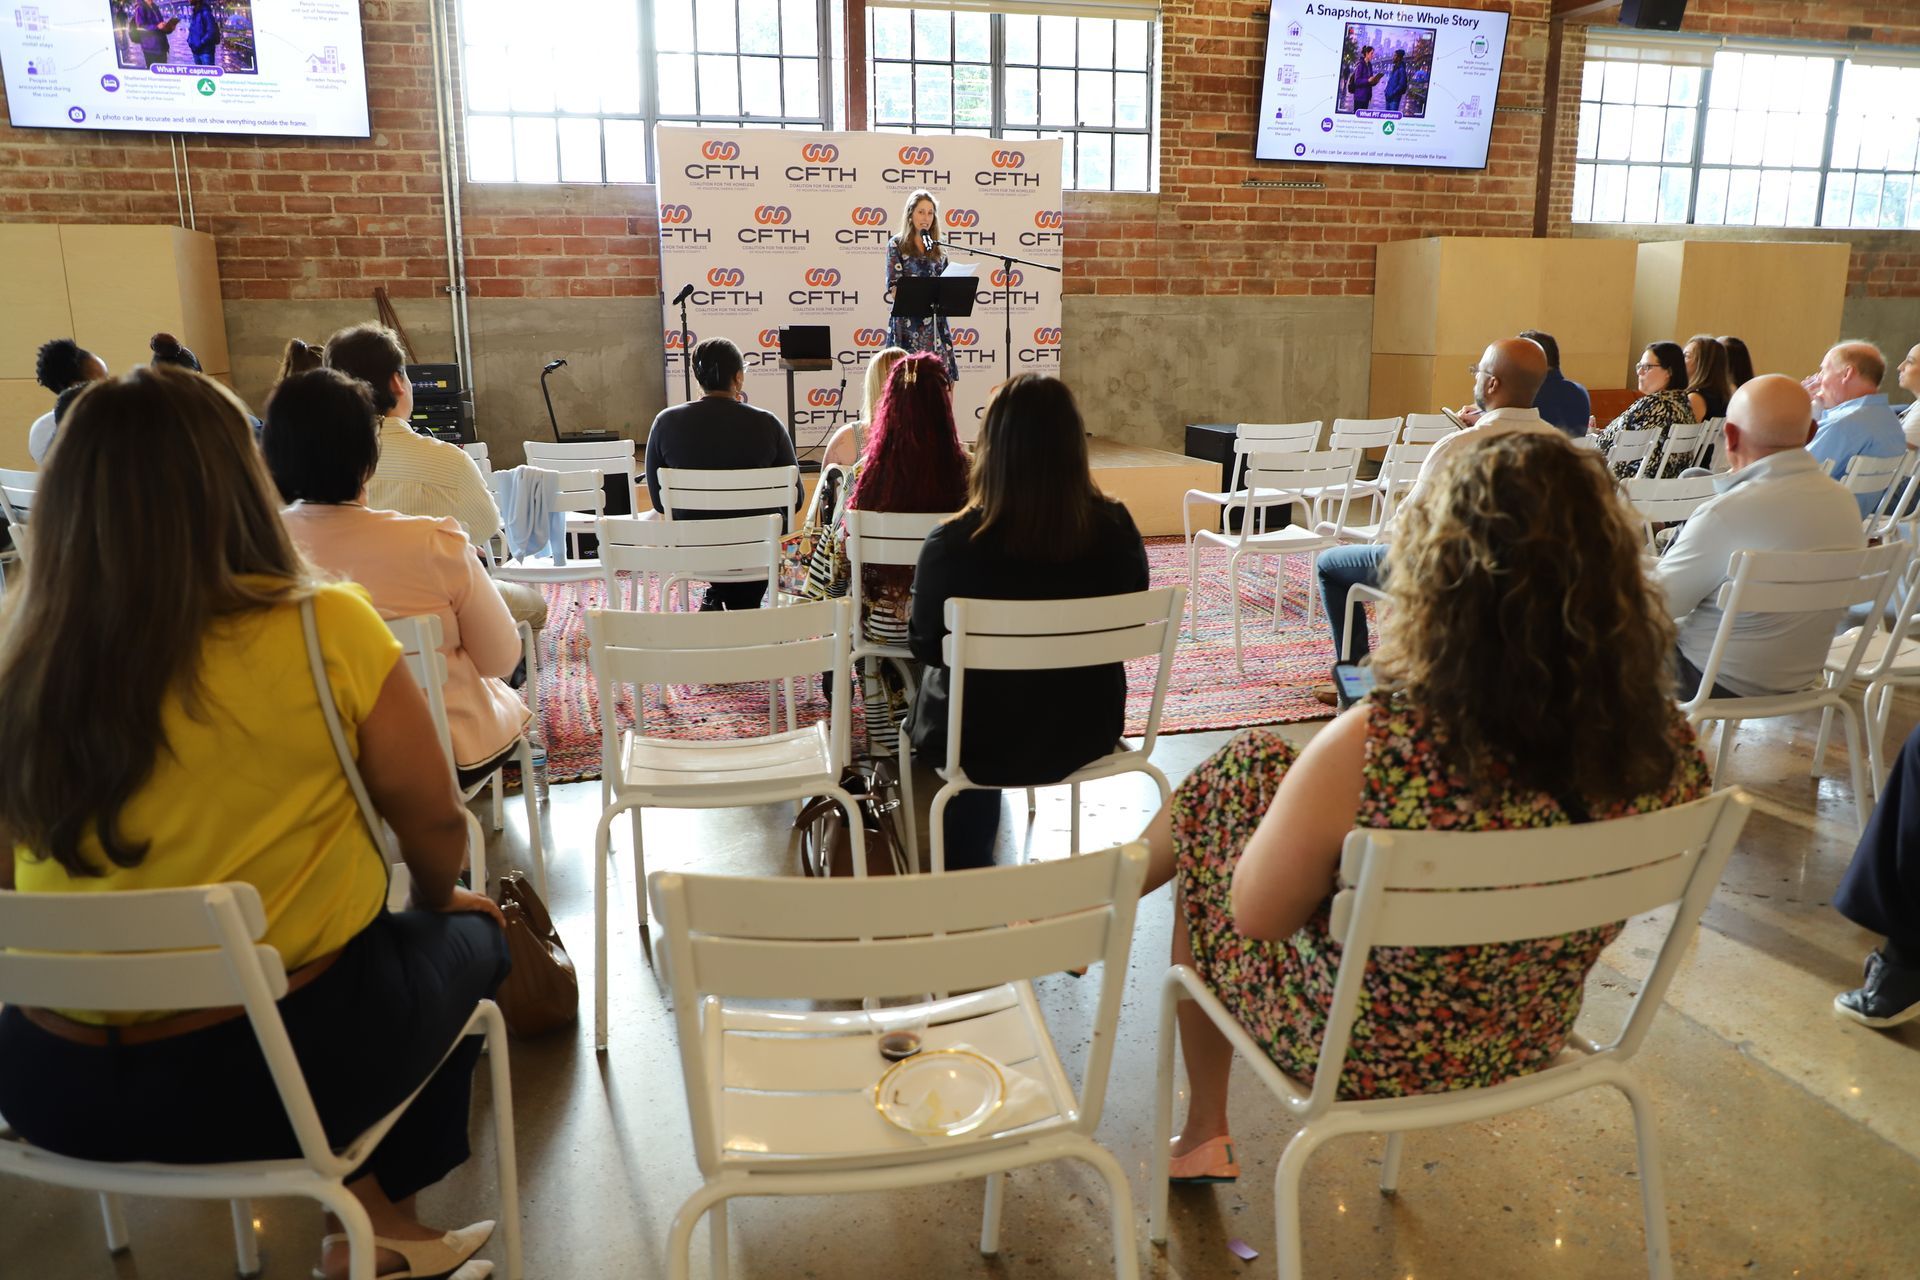
Every year, Houston’s Point-in-Time (PIT) Count helps provide a snapshot of homelessness across the region. But as speakers emphasized during CFTH Presents: The PIT Count — Behind the Numbers , no single number can fully explain homelessness, or the work required to address it. Hosted by the Coalition for the Homeless of Houston/Harris County (CFTH), the discussion brought together leaders from outreach, data systems, and public health to explore how Houston measures homelessness, why the PIT Count matters, and how year-round data helps guide the region’s homelessness response system.